Until recently, I just used Xdebug for debugging PHP locally with XAMPP. But now I needed to debug a problem with PayPal in WooCommerce on a remote server. This post shows you how to get this working.
Installing Xdebug on Uberspace is relatively easy – running the following command does it:
uberspace-install-pecl xdebug
My end of the php.ini with the Xdebug info looks like that:
extension_dir = /home/userName/pecl
zend_extension = xdebug.so
xdebug.default_enable = 1
xdebug.remote_enable = 1
xdebug.remote_handler = dbgp
xdebug.remote_host = 127.0.0.1
xdebug.remote_port = 9000
xdebug.remote_autostart = 1
xdebug.idekey = PHPSTORMCode language: JavaScript (javascript)
Of course, maybe you have to adjust the values – at least the userName.
My settings under Languages & Frameworks › PHP › Servers in PhpStorm look like that:
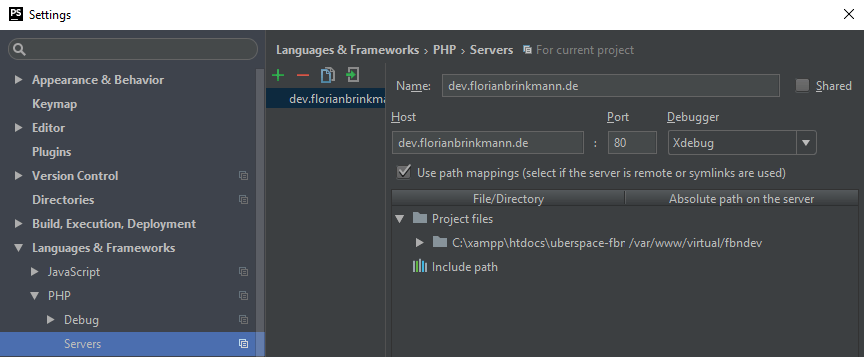
- Name and Host are the domain.
- Port is 80, Debugger is Xdebug.
- Check the Use path mappings.
- For the local project path, set the equivalent absolute path on the remote server.
Before listening to Xdebug on the remote server, we have to set up an SSH tunnel to the remote server. Here you need to use the same port which is used in the Xdebug settings in PhpStorm and the php.ini (in my case, and I think that is the default value, 9000). That is the command to create an SSH tunnel:
ssh -R 9000:localhost:9000 user@server.deCode language: CSS (css)After that, you can start debugging. You can read how to set up an SSH tunnel on Windows with putty in the Confluence of JetBrains. The command above works for Linux, Mac, and the Linux Subsystem on Windows 10.
Thanks to Lukas, who helped me get this thing working 🙂